1. What is syncing?
syncing is an useful library to synchronise and re-sample time series.
synchronisation is based on the fourier transform and the re-sampling is performed with a specific interpolation method.
2. Installation
To install it use (with root privileges):
$ pip install syncing
Or download the last git version and use (with root privileges):
$ python setup.py install
2.1. Install extras
Some additional functionality is enabled installing the following extras:
cli: enables the command line interface.
plot: enables to plot the model process and its workflow.
dev: installs all libraries plus the development libraries.
To install syncing and all extras (except development libraries), do:
$ pip install syncing[all]
3. Synchronising Laboratory Data
This example shows how to synchronise two data-sets obd and dyno (respectively they are the On-Board Diagnostics of a vehicle and Chassis dynamometer) with a reference signal ref. To achieve this we use the model syncing model to visualize the model:
>>> from syncing.model import dsp
>>> model = dsp.register()
>>> model.plot(view=False)
SiteMap(...)
Tip
You can explore the diagram by clicking on it.
First of all, we generate synthetically the data-sets to feed the model:
>>> import numpy as np
>>> data_sets = {}
>>> time = np.arange(0, 150, .1)
>>> velocity = (1 + np.sin(time / 10)) * 60
>>> data_sets['ref'] = dict(
...     time=time,                                               # [10 Hz]
...     velocity=velocity / 3.6                                  # [m/s]
... )
>>> data_sets['obd'] = dict(
...     time=time[::10] + 12,                                    # 1 Hz
...     velocity=velocity[::10] + np.random.normal(0, 5, 150),   # [km/h]
...     engine_rpm=np.maximum(
...         np.random.normal(velocity[::10] * 3 + 600, 5), 800
...     )                                                        # [RPM]
... )
>>> data_sets['dyno'] = dict(
...     time=time + 6.66,                                        # 10 Hz
...     velocity=velocity + np.random.normal(0, 1, 1500)         # [km/h]
... )
To synchronise the data-sets and plot the workflow:
>>> from syncing.model import dsp
>>> sol = dsp(dict(
...     data=data_sets, x_label='time', y_label='velocity',
...     reference_name='ref', interpolation_method='cubic'
... ))
>>> sol.plot(view=False)
SiteMap(...)
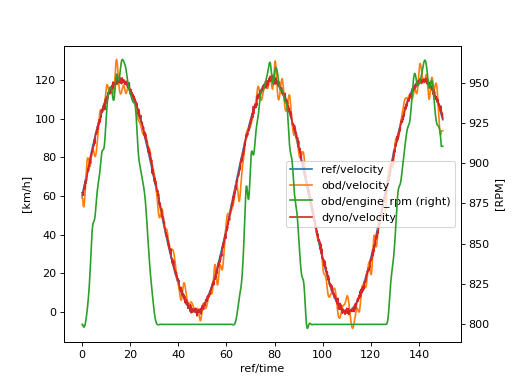
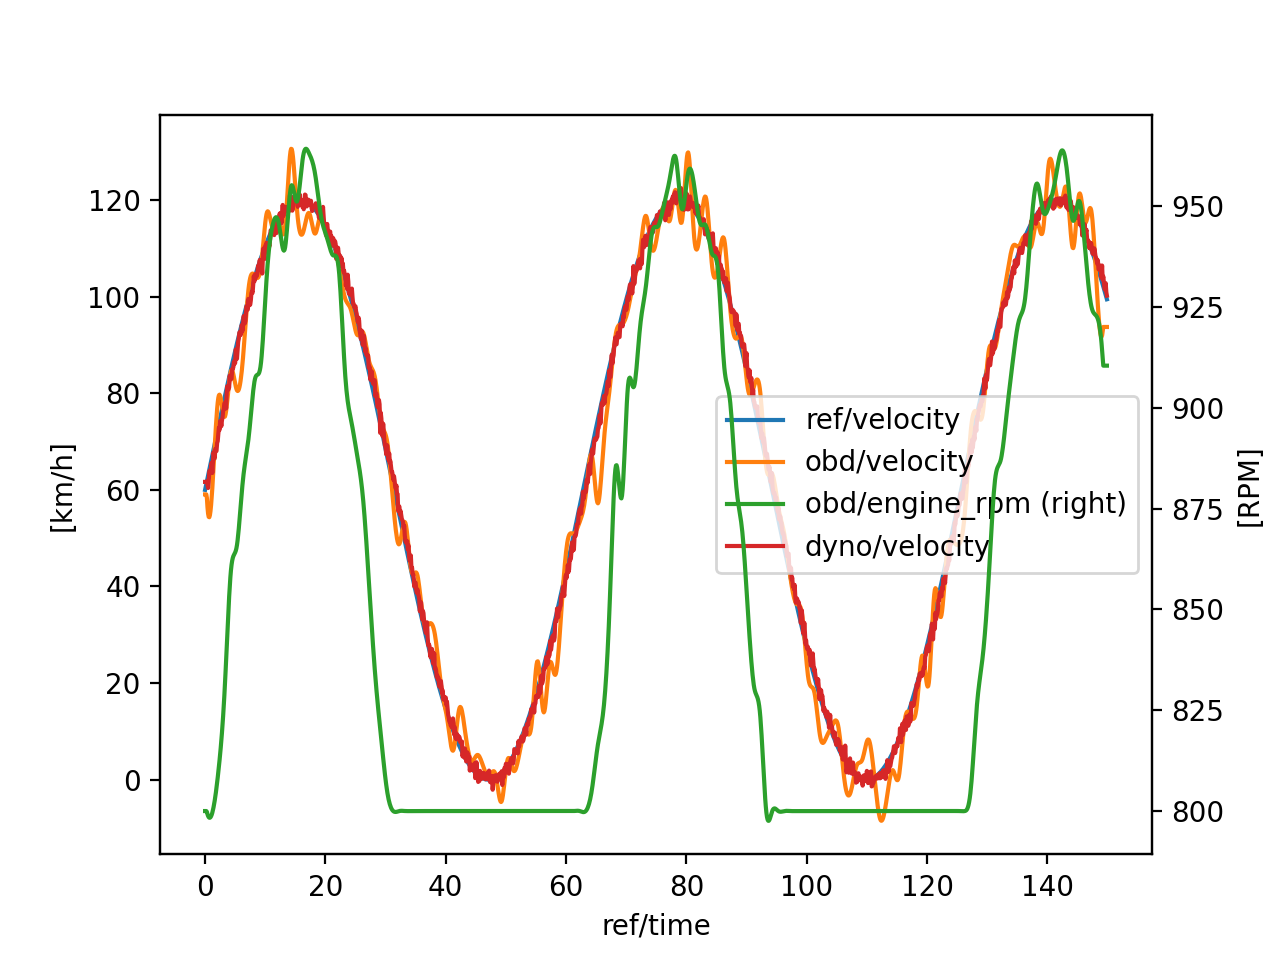
Finally, we can analyze the time shifts and the synchronised and re-sampled data-sets:
>>> import pandas as pd
>>> import schedula as sh
>>> pd.DataFrame(sol['shifts'], index=[0])
     obd  dyno
...
>>> df = pd.DataFrame(dict(sh.stack_nested_keys(sol['resampled'])))
>>> df.columns = df.columns.map('/'.join)
>>> df['ref/velocity'] *= 3.6
>>> ax = df.set_index('ref/time').plot(secondary_y='obd/engine_rpm')
>>> ax.set_ylabel('[km/h]'); ax.right_ax.set_ylabel('[RPM]')
Text(...)
(Source code, png, hires.png, pdf)